
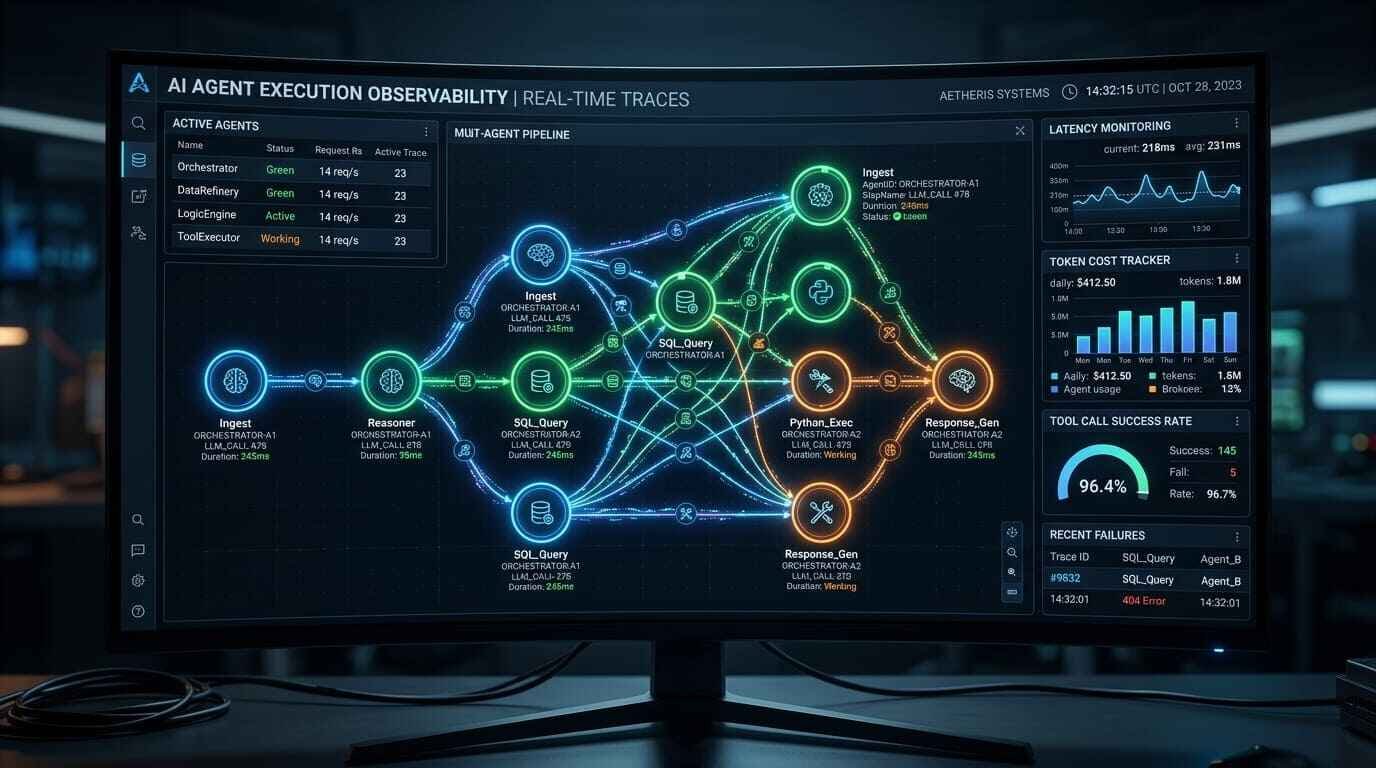
AI agent observability is the operational discipline that has become the single most urgent gap in enterprise AI programs in 2026 — and most organizations have not yet realized it exists until something breaks in production.
Enterprises have spent the last eighteen months deploying AI agents at speed. They have invested in orchestration layers, memory architectures, and security controls. What they have not invested in — until now — is the infrastructure to actually see what those agents are doing in real time, across every step of every workflow, at the moment a failure occurs. That blind spot is costing enterprises both money and trust.
This pillar page is the definitive enterprise guide to AI agent observability: what it means, why it is architecturally different from traditional application monitoring, and how to implement a production-grade observability stack that gives your engineering, compliance, and finance teams the visibility they need to scale autonomous AI with confidence.
What Is AI Agent Observability?
AI agent observability is the practice of instrumenting, collecting, and analyzing telemetry data from AI agent systems to understand their internal states, decision pathways, and operational performance — not just whether they succeeded or failed at a task, but why they made each decision along the way.
This definition matters because it separates AI agent observability from conventional application performance monitoring (APM). Traditional APM tools watch latency, uptime, and error rates. Those metrics remain relevant in agentic systems, but they are insufficient. An agent can return a response with zero latency errors and still have hallucinated a fact, selected the wrong tool, misinterpreted user intent, or executed a multi-step workflow in a way that quietly caused downstream data corruption.
AI agent observability closes that gap by capturing the full execution trace: every model call, every tool invocation, every reasoning step, every memory retrieval, and every handoff between agents in a multi-agent pipeline. It makes the invisible visible.
The Three Pillars of Agent Observability
Effective AI agent observability rests on three telemetry pillars:
Traces capture the full execution path of an agent task from initial prompt receipt through every intermediate reasoning step to final output. In multi-agent systems, distributed traces connect parent and child agent spans so you can visualize exactly where in a complex workflow a problem originated.
Metrics provide aggregated quantitative signals: token consumption per task, tool call success rates, latency per agent step, cost per workflow execution, and model confidence scores where available. These feed dashboards and alert systems.
Logs record the granular event stream: what the agent received as input, what it queried, what it retrieved, what it generated, and what actions it took — in sequence and with timestamps.
When these three pillars are instrumented correctly and correlated in a unified observability platform, engineering and operations teams can move from reactive debugging to proactive quality management.
Why AI Agent Observability Demands a Different Architecture
When auditing B2B SaaS architectures as a Digital Growth Specialist, my immediate focus is always on where the existing monitoring stack breaks down when you introduce agentic systems. In virtually every enterprise I have analyzed in 2026, the answer is the same: the legacy APM tooling was designed for deterministic systems. AI agents are fundamentally probabilistic, stateful, and multi-step — and that changes everything about how observability must be architected.
The Determinism Problem
Traditional software systems execute predictable code paths. Given the same input, a well-written function returns the same output. Monitoring that system means watching whether the function executes and how fast it runs.
AI agents do not work this way. The same user query, sent to the same agent with the same tools, can produce meaningfully different reasoning chains and outputs depending on model temperature, retrieved context, tool availability, and prompt state. An agent that succeeded on a task yesterday may fail on a nearly identical task today — for reasons that are invisible without trace-level observability.
This probabilistic nature means your observability stack must capture not just what happened but what the agent was reasoning about at each step.
The Multi-Step Workflow Problem
A single user-facing action in a modern enterprise AI deployment may trigger a chain of agent calls: a routing agent, a research agent, a code execution agent, a summarization agent, and a human escalation agent — each passing context to the next. When the final output is wrong or a cost spike appears on your cloud bill, you need to trace the problem back through every hop in that chain.
Without distributed tracing instrumented across the full pipeline, that investigation can take hours or days. With proper AI agent observability tooling, it takes minutes.
The Cost Attribution Problem
AI agents consume compute and token budget at every step. In the absence of granular observability, enterprise AI teams consistently struggle to attribute costs accurately — which makes optimization impossible and budget justification to finance leadership nearly untenable.
AI FinOps disciplines require observability data as their input. You cannot govern what you cannot measure.
The AI Agent Observability Stack: What Enterprise Teams Need to Deploy
Layer 1: Instrumentation
Instrumentation is the foundation. Every AI agent in your production environment must emit standardized telemetry in a format your observability platform can ingest and correlate.
The emerging enterprise standard for AI agent instrumentation is OpenTelemetry (OTel) extended with LLM-specific semantic conventions. Google’s Gemini Enterprise Agent Platform, launched at Google Cloud Next 2026, built its Agent Observability layer on OpenTelemetry compliance specifically to enable interoperability with third-party observability platforms alongside its own native dashboards.
Instrumentation must cover: model inputs and outputs, tool call definitions and results, agent-to-agent communication payloads, memory read and write operations, error states and retry logic, and latency at every transition point.
For enterprises using frameworks such as LangChain, LlamaIndex, CrewAI, or OpenAI Agents SDK, many modern observability platforms offer native SDK integrations that auto-instrument traces with minimal code changes — reducing the engineering burden of retrofitting observability into existing agent deployments.
Layer 2: Trace Collection and Storage
Raw telemetry data must flow into a collection backend that can handle the volume, velocity, and variable structure of agent trace data. This backend must support:
High-cardinality data storage — agent traces contain dozens of unique attributes per span, far exceeding the cardinality tolerance of traditional time-series databases.
Semantic search over trace content — debugging agent behavior requires searching traces by content characteristics (e.g., “find all traces where the agent called the web search tool more than three times”) not just by timestamp or error code.
Long-term retention with cost controls — compliance teams in regulated industries need 90-day or longer trace retention. Storage costs must be managed through intelligent sampling and compression strategies.
Layer 3: Real-Time Monitoring and Alerting
Observability platforms must translate raw trace data into actionable signals without delay. Enterprise AI agent observability requires alert policies that go beyond traditional threshold-based monitoring:
Quality degradation alerts trigger when agent task success rates drop below a defined baseline across a rolling window — even when no explicit errors are returned.
Hallucination pattern alerts flag when agent outputs contain confidence signals or semantic patterns associated with known failure modes in your specific use cases.
Cost anomaly alerts detect when token consumption or tool call frequency for a specific agent or workflow type deviates significantly from its established baseline — catching runaway loops, inefficient retrieval patterns, or model misconfiguration before they generate unexpected cloud spend.
Security anomaly alerts integrate with your AI agent red teaming findings to flag when agent behavior in production matches patterns identified during adversarial testing — a sign that a real attack may be in progress.
Layer 4: Root Cause Analysis and Debugging Tools
When an alert fires, your engineering team needs to move from alert to root cause in minutes, not hours. This layer includes:
Visual trace explorers that render the full agent execution tree as an interactive graph, showing every step, every tool call, and every model response in sequence with timing overlays.
Side-by-side trace comparison allows engineers to compare a failing trace against a successful trace from the same agent to pinpoint exactly where the execution path diverged.
Prompt and context replay lets engineers re-execute a failing trace with modified prompts or context windows to test hypotheses without deploying code changes to production.
Automated failure clustering groups semantically similar failures together so engineering teams can identify systemic issues — such as a class of user queries that consistently confuses a particular agent — rather than treating each failure as an isolated event.
Layer 5: Continuous Quality Management
The highest-maturity AI agent observability programs move beyond reactive debugging into proactive quality management. This requires:
Automated evaluation integration — connecting your observability platform to your AI agent evaluation framework so that production traces are continuously scored against quality rubrics without requiring manual review.
A/B testing infrastructure — routing a percentage of production traffic through updated agent configurations before full rollout, with observability metrics determining which version performs better on quality, cost, and latency dimensions.
Drift detection — monitoring for gradual degradation in agent output quality over time, which often occurs when the external world that agents are querying changes in ways that make their reasoning patterns less reliable.
AI Agent Observability in Multi-Agent Systems
Multi-agent architectures introduce compounding observability challenges that single-agent monitoring cannot address. When you have a multi-agent orchestration layer managing dozens of specialist agents in parallel and in sequence, your observability infrastructure must support distributed tracing that preserves the parent-child relationship between agent spans across asynchronous execution boundaries.
This is technically non-trivial. Agents that run asynchronously — spawning sub-agents and awaiting their results — break the simple request-response tracing model that most APM tools assume. Enterprise AI teams building multi-agent systems must explicitly instrument trace context propagation so that the full execution lineage is preserved even when individual agent tasks complete out of order or with variable latency.
The Google Gemini Enterprise Agent Platform’s Agent Observability dashboard addresses this directly, providing visual execution path tracing for multi-agent workflows with built-in support for long-running agents that maintain state across sessions measured in days — a capability that reflects the operational maturity the market has reached in 2026.
For enterprises not using Google’s native tooling, platforms such as Braintrust, Langfuse, and Arize Phoenix offer framework-agnostic distributed tracing with multi-agent pipeline support.
Compliance, Governance, and the Regulatory Dimension of Observability
AI agent observability is not solely an engineering discipline. In regulated industries — financial services, healthcare, legal, and government — it is increasingly a compliance requirement.
The EU AI Act’s requirements for high-risk AI systems mandate documentation of AI system behavior and logging sufficient to enable post-hoc auditing of decisions. In the United States, the NIST AI RMF’s govern and manage functions explicitly require ongoing monitoring of deployed AI systems.
Compliance teams need observability data structured in ways that support audit workflows: immutable logs with cryptographic integrity guarantees, role-based access controls on sensitive trace data, retention schedules that align with regulatory timelines, and exportable audit reports that can be produced on demand.
This intersection of observability and governance is exactly the gap that context engineering for AI agents frameworks must address — ensuring that the information available to agents during execution is itself documented and traceable, not just the outputs those agents produce.
The official Google Cloud Gemini Enterprise Agent Platform documentation provides detailed technical specifications for Agent Observability, including OpenTelemetry compliance and audit trail implementation — a useful reference for enterprise architects designing their observability governance layer.
Building Your AI Agent Observability Implementation Roadmap
Phase 1: Baseline Instrumentation (Weeks 1–4)
Deploy OpenTelemetry-compatible instrumentation across all production AI agents. Focus on capturing the minimum viable telemetry set: model inputs/outputs, tool call results, end-to-end latency, and error states. Select an observability backend and validate that traces are being captured correctly for your highest-traffic agent workflows.
Phase 2: Dashboards and Alerting (Weeks 5–8)
Build operational dashboards that surface AI agent observability metrics for engineering, operations, and finance stakeholders. Implement cost anomaly alerts and quality degradation alerts for your most critical agent workflows. Establish baseline performance benchmarks that future releases will be measured against.
Phase 3: Root Cause Analysis Tooling (Weeks 9–12)
Implement visual trace explorers and automated failure clustering. Train engineering teams on AI agent debugging workflows. Begin conducting structured retrospectives on agent failures using trace data — replacing ad-hoc debugging with a systematic, evidence-based process.
Phase 4: Continuous Quality Integration (Weeks 13–20)
Connect your observability platform to your automated evaluation framework. Implement production A/B testing for agent configuration updates. Deploy drift detection monitoring and establish processes for acting on drift signals before they affect end-user experience.
Phase 5: Compliance and Governance Layer (Weeks 21–26)
Implement audit-grade logging with immutable retention, role-based access controls on trace data, and automated compliance reporting. Align observability data retention schedules with your regulatory requirements. Document your AI agent observability program as part of your broader AI governance framework.
Strategic Outlook & Implementation
When auditing B2B SaaS architectures as a Digital Growth Specialist, my immediate focus is always on the gap between what enterprises believe they are monitoring and what they are actually measuring. In 2026, that gap has never been wider — and AI agent observability is the discipline that closes it.
My assessment is direct: enterprises that invest in AI agent observability infrastructure in the next six months will accumulate an operational advantage that late movers will struggle to close. The reason is compounding. Observability data is not just a debugging tool — it is the training signal for your next generation of agent configurations. Organizations that are instrumenting production agent behavior today are building proprietary datasets that will inform better prompts, better context engineering, better tool selection logic, and better evaluation rubrics. Organizations that are not instrumenting are flying blind and will have nothing to learn from when they eventually do.
The market signals are unambiguous. Google’s decision to build Agent Observability as one of the four core pillars of the Gemini Enterprise Agent Platform reflects where enterprise demand is concentrated. The Braintrust, Langfuse, and Arize category is growing at a pace that mirrors the early DevOps observability wave — which tells me the window for establishing internal observability expertise before it becomes an outsourced commodity is short.
My implementation recommendation for enterprise AI teams: prioritize instrumentation before scale. Do not add agents to your production environment without first confirming that those agents are emitting traceable telemetry. The cost of retrofitting observability into a sprawling, un-instrumented agent fleet is an order of magnitude higher than building instrumentation in from the start.
Conclusion
AI agent observability is no longer optional for enterprises running AI agents in production. It is the operational foundation that makes everything else work — quality management, cost control, security monitoring, compliance documentation, and continuous improvement.
The enterprises that will extract maximum value from their AI agent investments in 2026 and beyond are not necessarily those with the most agents, or the most advanced models. They are the enterprises that can see clearly what their agents are doing, diagnose problems before users notice them, attribute costs accurately to the workflows that generate them, and systematically improve agent performance using evidence from production behavior.
Invest in your observability stack before you scale your agent fleet. The organizations that do will build agentic AI systems that earn enterprise-wide trust — and that trust is the prerequisite for every AI capability that follows.
Frequently Asked Questions
What is the difference between AI agent observability and traditional application monitoring?
Traditional application monitoring tracks whether a system is running and how fast it responds. AI agent observability goes deeper — it captures the full reasoning chain of an agent, including model inputs and outputs, tool invocations, memory retrievals, and inter-agent communication, providing the context needed to understand why an agent behaved as it did, not just whether it completed a task.
Which observability tools are best suited for enterprise AI agent deployments in 2026?
Enterprise teams have multiple strong options depending on their infrastructure. Google’s native Agent Observability within the Gemini Enterprise Agent Platform is the most integrated choice for Google Cloud deployments. Framework-agnostic alternatives include Braintrust (evaluation-first architecture), Langfuse (open-source with self-hosting), Arize Phoenix (ML and LLM governance for regulated industries), and Helicone (proxy-based quick-setup approach).
How does AI agent observability support regulatory compliance?
Observability platforms that implement immutable logging, cryptographic audit trails, and role-based access controls provide the documentation layer required by regulations such as the EU AI Act for high-risk AI systems and the NIST AI RMF. Trace data enables post-hoc auditing of agent decisions, which compliance and legal teams require when AI agents are involved in regulated business processes.
What should enterprises instrument first when deploying AI agent observability?
Start with the highest-traffic, highest-risk agent workflows. Ensure that model inputs and outputs, tool call results, and end-to-end latency are captured for every execution. Establish baseline performance metrics during this initial phase — you cannot detect degradation without a baseline to compare against.
How does AI agent observability relate to AI agent evaluation?
Observability and evaluation are complementary disciplines. Observability provides the raw trace data from production agent behavior. Evaluation applies quality scoring rubrics to that data — either in real time or in batch — to assess whether agents are meeting defined performance standards. The most mature enterprise AI programs connect their observability platforms directly to their evaluation frameworks so that production traffic is continuously scored without requiring manual review.
Author Bio
Hi, I’m Waqas Raza. Over the last 20 years as a Finance Manager and Digital Growth Specialist, I’ve focused on scaling technical B2B SaaS properties and navigating complex architectures. I write at Vitalora Life to share what actually works when you’re responsible for both the numbers and the systems — from AI governance frameworks to enterprise cost optimization strategies that hold up under scrutiny.